Chart Fields
The following fields are found on the chart panel.
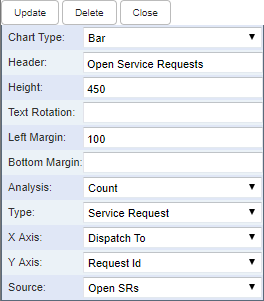
- Chart Type: Select the type of chart, Line, Column, Pie, Bar, or Spline.
- Header: Enter the name for the chart that appears in the header.
- Height: Enter the number of pixels to use for the height of the chart. The default is 200.
- Text Rotation: Enter the number of degrees to rotate the text of the chart. This does not apply to pie charts.
- Left Margin: Enter the number of pixels for the left margin.
- Bottom Margin: Enter the number of pixels for the bottom margin.
- Analysis: Select Count, Count By Week, Count By Month, County By Year, or Sum. Count, Count By Week, Count By Month, and Count By Year give you the number of each work activity or asset broken down by week, month, or year. Sum gives you the cost of each work activity or asset. The X Axis and Y Axis fields are limited based on what is selected for this field.
- Type: Select Service Request, Work Order, Inspection, PLL, or GIS. The GIS type is for GIS saved searches.
- X Axis: For work activity searches, select Description, Status, Dispatch To, Submit To, Closed By, Priority, or Project Name as the field that is shown as the X axis. For GIS searches, select the GIS field that is shown as the X axis.
 NOTE: This field is limited to only string fields when using a GIS search.
- Y Axis: Select the Y axis of the chart.
- Source: Select the desired saved search for the chart. If this field is blank, there aren't any saved searches created for the Type you selected.

